

IEM Katowice 2021
General Stats
261
Games Played
78
Hours Played
3,688,921
Actions Executed
Matchups
66
vs
42%28:3858%
65
vs
45%29:3655%
46
vs
46%21:2554%
38
vs
30
vs
16
vs
Average Resources spent per game
12,728,830
Total Minerals
3,149,200
Total Gas
Maps Played
Romanticide LE49
Romanticide LE
49
Pillars of Gold LE48
Pillars of Gold LE
48
Deathaura LE48
Deathaura LE
48
Oxide LE41
Oxide LE
41
Lightshade LE38
Lightshade LE
38
Jagannatha LE30
Jagannatha LE
30
Submarine LE7
Submarine LE
7
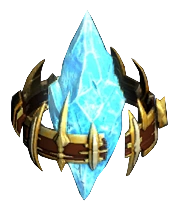
Look at the supply
9,073 supply structures generated 72,584 free supply
Gray values are from a previous event
3,376
23.44 (0) per game
3,236
15.63 (0) per game
2,461
14.39 (0) per game
Workers
43,065 Workers were created with 2,153,250 Minerals
Gray values are from a previous event
16,932
81.8 (0) per game
14,887
103.38 (0) per game

11,246
65.77 (0) per game

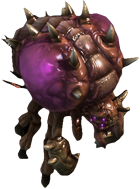
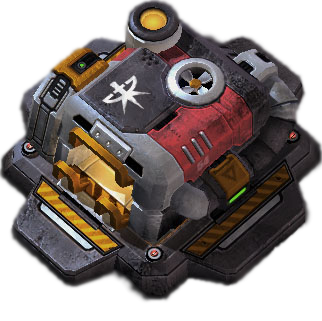
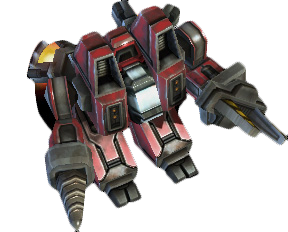
Most Popular Units
They account for a total of 3,045,750 minerals and 213,225 Gas
38,764

969,100 Minerals
21,030
1,051,500 Minerals
8,529

426,450 Minerals
213,225 Gas
213,225 Gas
5,987

598,700 Minerals